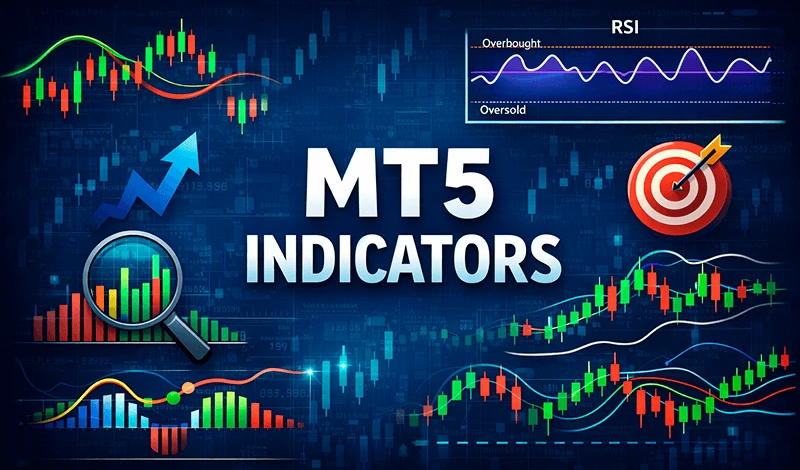
What are MT5 indicators?
MT5 indicators are analytical tools inside MetaTrader 5 that process price and volume data to help traders identify trends, momentum, volatility, and potential entry or exit points. They transform raw market data into visual signals that support structured decision-making.
Key takeaways
- MT5 indicators convert price data into actionable insights such as trend direction and momentum
- Different indicator types serve different purposes and should be matched to market conditions
- Indicators do not predict the market; they interpret past and current data
- Proper customization improves signal relevance for specific strategies
- Using fewer, well-chosen indicators is more effective than combining many
What Are MT5 Indicators
MT5 indicators are mathematical calculations applied to market data such as price, time, and tick volume. They are displayed directly on charts or in separate windows, helping traders interpret market behavior more objectively.
At a technical level, indicators use historical data points like open, high, low, and close prices. These values are processed through formulas to produce outputs such as averages, oscillations, or bands. The result is a visual layer that highlights patterns that may not be immediately visible on raw charts.
In practice, indicators serve three core purposes. First, they simplify complex price movements. Second, they standardize analysis by reducing subjectivity. Third, they provide structured signals that traders can integrate into a broader strategy.
Types of MT5 Indicators
MT5 includes several categories of indicators, each designed to analyze a specific aspect of market behavior. Understanding these types is essential for selecting the right tools.
Trend indicators
Trend indicators help determine the overall direction of the market. They are most effective when the market is moving consistently upward or downward.
Common examples include moving averages and Ichimoku. These tools smooth out price fluctuations and reveal whether the market is trending or consolidating. Traders often use them to confirm direction before entering trades.
Oscillators
Oscillators measure momentum and are typically used to identify overbought or oversold conditions. They operate within a fixed range, making them useful in sideways markets.
Examples include RSI, Stochastic, and MACD. These indicators help identify potential reversal points when the market lacks a clear trend.
Volume indicators
Volume indicators analyze the level of market activity. In MT5, volume is based on tick data rather than actual traded volume.
Tools like Volume and Money Flow Index provide insight into the strength behind price movements. Increasing volume often confirms trends, while declining volume may signal weakening momentum.
Volatility indicators
Volatility indicators measure the intensity of price movements. They do not indicate direction but rather how much the market is moving.
Examples include Bollinger Bands and Average True Range. These indicators are commonly used to identify breakout opportunities or periods of consolidation.
Bill Williams indicators
This group focuses on market structure and behavior. It includes tools such as Alligator, Fractals, and Awesome Oscillator.
These indicators are often used together to analyze trend phases and market cycles, offering a more conceptual approach to technical analysis.
Indicator comparison table
Type | Purpose | Example | Best Market Condition |
Trend | Identify direction | Moving Average | Trending markets |
Oscillator | Detect overbought/oversold | RSI | Sideways markets |
Volume | Measure activity | Money Flow Index | Trend confirmation |
Volatility | Measure price movement intensity | Bollinger Bands | Breakouts, consolidation |
Bill Williams | Analyze market structure | Alligator | Mixed conditions |
How to Add an Indicator in MT5
Adding an indicator in MT5 follows a structured workflow that is consistent across most setups.
First, open the Navigator panel by pressing Ctrl + N or selecting it from the View menu. This panel contains all available indicators.
Next, expand the Indicators section and browse through the categories. Each category contains multiple tools designed for different analytical purposes.
To apply an indicator, drag it onto the chart. This action automatically opens the settings window, where you can adjust parameters before confirming.
After clicking OK, the indicator appears on the chart. If needed, you can modify it later by double-clicking on the indicator or accessing its properties through the right-click menu.
How to Customize Indicator Settings
Customization is a critical step in making indicators relevant to a specific trading approach. Default settings are general and may not suit all strategies.
Input parameters define how the indicator calculates its values. This includes settings such as periods, applied price, and smoothing methods. Adjusting these parameters directly affects sensitivity and responsiveness.
Color settings control the visual appearance. While this may seem minor, clarity is essential when analyzing charts quickly. Choosing distinct colors helps separate different indicators and signals.
Levels allow traders to define thresholds such as overbought or oversold zones. These horizontal reference points are particularly important for oscillators.
Customization should always align with the trader’s time horizon and strategy. Short-term traders typically prefer faster, more responsive settings, while long-term traders use smoother configurations.
How MT5 Indicators Work in Practice
Indicators operate through a three-step process: data input, calculation, and output.
The input stage involves collecting market data such as price and timeframes. This data forms the foundation for all calculations.
During the calculation phase, the indicator applies its formula. For example, a moving average calculates the average price over a defined number of periods, while RSI measures the speed and change of price movements.
The output stage presents the result visually. This can be a line, histogram, or band that traders interpret as signals.
In real trading conditions, indicators are rarely used in isolation. Instead, they are combined with price action and context. For example, a trend indicator may define direction, while an oscillator confirms entry timing.
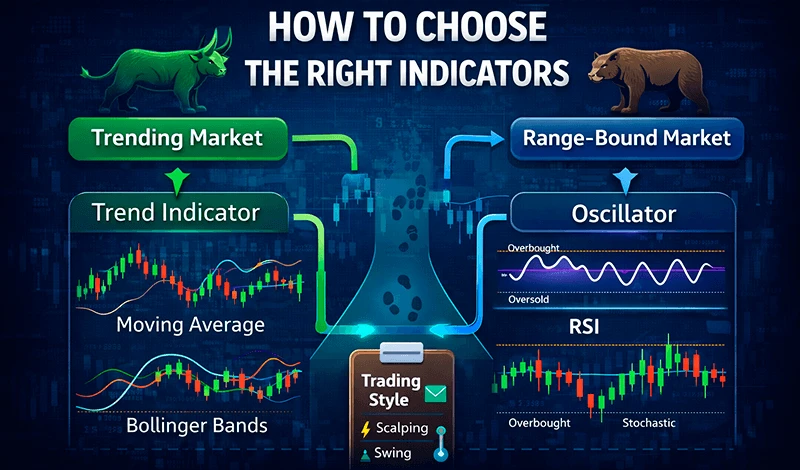
How to Choose the Right Indicators
Choosing the right indicators is not about finding the “best” tool, but about matching indicators to the current market environment and your trading approach. Indicators are context-dependent, which means their effectiveness changes depending on how and when they are used.
The first step is understanding market conditions. In trending markets, indicators that follow direction are more reliable because they help confirm the strength and continuation of a move. Tools like moving averages or trend-following systems work well here because they smooth price action and highlight direction. In contrast, when the market is moving sideways within a range, oscillators become more useful. They help identify potential reversal points by showing when price is overbought or oversold.
The second factor is trading style. Short-term traders, such as scalpers, need indicators that react quickly to price changes. This usually means using shorter periods and more sensitive settings. However, faster signals also increase noise, so precision becomes important. Swing traders, on the other hand, prefer smoother indicators that filter out small fluctuations and focus on larger moves. Their goal is not to catch every movement, but to capture more stable trends.
Another important consideration is indicator combination. Using multiple indicators of the same type does not improve decision-making. For example, combining several trend indicators often results in identical signals with slight delays, which adds no real value. Instead, it is more effective to combine different types of indicators. A typical structure might include one trend indicator to define direction and one oscillator to refine entry timing.
It is also important to think in terms of simplicity and clarity. A clean chart with a clear logic behind each tool is far more effective than a complex setup. Each indicator should have a specific role. If an indicator does not add new information, it is likely unnecessary.
Over time, the selection process should become more structured. Traders should observe how indicators behave in different conditions and refine their setup gradually rather than constantly switching tools.
Quick checklist: choosing MT5 indicators
- Identify market condition first: trending or ranging
- Choose indicator type based on condition (trend vs oscillator)
- Match indicator speed to your trading style (fast for scalping, smooth for swing)
- Limit the number of indicators to 2–3
- Combine different types, not similar ones
- Make sure each indicator has a clear purpose
- Adjust settings based on timeframe and strategy
- Keep the chart clean and readable
This structured approach helps avoid randomness and ensures that indicators are used as tools within a clear trading logic rather than as isolated signals.
Common Mistakes When Using MT5 Indicators
One of the most common mistakes is overloading the chart with too many indicators. This usually comes from the desire to get confirmation from multiple sources. In reality, adding several indicators that measure the same thing, such as multiple trend indicators, does not improve accuracy. Instead, it creates conflicting signals and slows down decision-making. Traders may hesitate or miss opportunities because the chart becomes unclear. The more effective approach is to use a small number of indicators that serve different functions, for example one for trend and one for momentum.
Another frequent issue is blindly following indicator signals without understanding how they work. Indicators are based on historical data, which means they always react to price rather than predict it. This creates a lag, especially in fast-moving markets. For example, by the time a signal appears, part of the move may already be over. Traders who rely only on indicators often enter late or exit too early. A more reliable approach is to combine indicators with price action, such as support and resistance levels or market structure.
Ignoring market conditions is another major mistake. Many traders use the same indicator setup regardless of whether the market is trending or moving sideways. This reduces the effectiveness of the tools. For example, oscillators like RSI work well in ranging markets but can give misleading signals during strong trends. On the other hand, trend indicators perform poorly in sideways conditions. The solution is to first identify the market environment and then choose indicators that are appropriate for that condition.
Using default settings without adjustment is also a common problem. Standard indicator parameters are designed to work reasonably well across different markets, but they are not optimized for any specific strategy. Traders who do not adjust settings may find that signals are either too slow or too sensitive. For instance, a short-term trader using default moving average settings may miss quick opportunities. Adjusting parameters based on timeframe and strategy can significantly improve performance.
Another mistake is treating indicators as standalone decision tools. Indicators are meant to support analysis, not replace it. Relying entirely on one indicator, such as taking every RSI overbought signal as a sell, often leads to inconsistent results. Markets are influenced by multiple factors, and indicators reflect only a part of that picture. A more structured approach is to use indicators as part of a broader framework that includes context, timing, and risk management.
Finally, many traders neglect consistency in how they use indicators. Constantly changing tools or settings in search of better results makes it difficult to evaluate performance. Without consistency, it is impossible to understand whether a strategy actually works. A better approach is to choose a simple setup, test it over time, and make gradual improvements based on observed results.
Overall, most mistakes with MT5 indicators come from misuse rather than the tools themselves. Keeping the setup simple, adapting to market conditions, and understanding how each indicator works can significantly improve trading decisions.
FAQ
What are MT5 indicators?
MT5 indicators are tools that analyze price and volume data to help traders identify trends, momentum, and potential trade opportunities.
Are MT5 indicators accurate?
Indicators are not predictive tools. They interpret historical data, and their effectiveness depends on how they are used within a broader strategy.
How many indicators should I use?
Most traders use two to three indicators. This balance provides sufficient information without creating unnecessary complexity.
What is the best MT5 indicator?
There is no single best indicator. The choice depends on the trading strategy, market conditions, and personal preferences.
Can I add custom indicators to MT5?
Yes, MT5 supports custom indicators that can be installed or developed to suit specific strategies.
Do indicators work in all markets?
Indicators can be applied to any market, but their effectiveness varies depending on volatility, liquidity, and market structure.
Should beginners use indicators?
Yes, but beginners should focus on understanding a few core indicators rather than using many at once.
Need step-by-step setup instructions?
Read: How to Add Indicators in MetaTrader 5
Meet the Author
Vanessa Polson is a marketing manager at NordFX with over twelve years of experience in online marketing within the financial services industry. She has developed and executed data-driven campaigns across search, social, and display channels in in-house environments. Her work focuses on translating complex financial products and trading tools into clear, practical educational content, giving her a broad and well-rounded view of the global trading landscape.
Connect with Vanessa on LinkedIn.
العودة العودة
