Last updated: June 2026
What is Turtle Soup trading?
Turtle Soup trading is a false breakout trading strategy that aims to profit from liquidity sweeps and failed breakouts. Instead of following a breakout, traders wait for the price to reverse back into its previous range before entering a trade, typically using support, resistance, and confirmation signals to improve accuracy.
Turtle Soup Trading is a powerful strategy that helps traders exploit false breakouts and liquidity traps in financial markets. Turtle Soup trading is a false breakout trading strategy that helps traders identify liquidity grabs and potential market reversals in forex, stocks, indices, and cryptocurrencies. Unlike traditional breakout strategies that aim to follow momentum, Turtle Soup focuses on identifying failed breakouts and taking advantage of market reversals. By understanding how liquidity sweeps occur and how big players manipulate price action, traders can position themselves on the right side of the market. In this guide, we explain what Turtle Soup trading is, how to identify high-probability setups, and how to execute this strategy across different asset classes.
Key Takeaways
- Exploiting False Breakouts: The Turtle Soup strategy focuses on identifying and trading against false breakouts, turning potential market traps into profit opportunities.
- Historical Significance: Rooted in the original Turtle Trading method, Turtle Soup offers a contrarian approach by targeting failed breakouts.
- Structured Identification: Recognizing specific patterns, such as liquidity sweeps and market structure shifts, is crucial for effective Turtle Soup setups.
- Versatility Across Markets: While initially applied to commodities, the strategy is adaptable to forex, indices, and other financial instruments.
- Risk Management Emphasis: Implementing strict risk controls, including precise stop-loss placements, is essential to mitigate potential drawbacks.
- Multi-Timeframe Confirmation: Combining higher-timeframe support and resistance analysis with lower-timeframe confirmation can improve the quality of Turtle Soup trading setups.
What is Turtle Soup?
Turtle Soup is a false breakout trading strategy designed to capitalize on liquidity sweeps and failed breakouts that often mislead the majority of market participants. Instead of following breakouts in the hope of catching a strong trend, Turtle Soup traders wait for breakouts to fail before entering trades in the opposite direction. This strategy is especially effective in ranging markets, where price repeatedly tests key support and resistance levels but struggles to sustain a breakout.
At the heart of this strategy is the concept of liquidity manipulation. Large financial institutions, market makers, and algorithmic traders often target areas where retail traders place their stop-loss orders. These areas, known as liquidity pools, are typically found above recent highs and below recent lows. When the price moves into one of these liquidity zones, it can trigger a wave of stop-loss executions or encourage new breakout traders to enter the market. If the breakout does not hold and the price reverses, a Turtle Soup setup is in play, signaling an opportunity to trade against the failed breakout.
To successfully trade Turtle Soup setups, traders must be able to recognize clear signs of false breakouts. This often involves watching for price movements that momentarily break a key level but fail to gain momentum in that direction. If the price quickly returns inside the previous range, it suggests that the breakout was not genuine and that liquidity was simply being collected before a reversal.
The strategy works best when combined with additional confirmation factors, such as higher timeframe analysis, candlestick patterns, and volume shifts. A well-executed Turtle Soup trade allows traders to take advantage of market inefficiencies, positioning themselves on the right side of price action instead of falling into common breakout traps.

Why Is It Called Turtle Soup Trading?
The name Turtle Soup is a reference to the original Turtle Trading system, developed in the 1980s by Richard Dennis and William Eckhardt. Their strategy was based on identifying strong trends and entering trades on breakouts, expecting price to continue moving in the same direction.
Turtle Soup takes the opposite approach. Instead of betting on breakouts succeeding, it profits from those that fail. By targeting false breakouts and trading in the opposite direction, traders effectively turn the original system upside down, using failed trend-following setups as opportunities for reversal trades. This is where the name "Turtle Soup" comes from—traders metaphorically make soup out of the failed breakouts that were supposed to lead to new trends.
This strategy is particularly useful in markets like forex and cryptocurrencies, where liquidity grabs are common. Since major market participants frequently manipulate price to trigger stop-losses before reversing direction, traders who understand this behavior can use Turtle Soup to their advantage. By identifying areas where liquidity is likely to be collected and waiting for a breakout failure, traders can avoid falling into market traps and instead profit from them.
How to Identify a Turtle Soup Setup?
Identifying a Turtle Soup setup requires traders to spot specific conditions in the market that indicate a false breakout and a potential price reversal. This is not as simple as just looking for price breaking above or below a key level—it involves understanding how liquidity moves, where stop-loss orders are positioned, and when large market participants may be triggering false moves before reversing price direction.
The first step is to analyze key swing highs and lows on higher timeframes. These levels act as natural liquidity pools where many traders place their stop-losses. When price approaches one of these levels, it often accelerates as stop-loss orders are triggered. If the breakout fails and price quickly reverses back into the range, a Turtle Soup setup is forming.
To increase the accuracy of these setups, traders often combine them with additional confirmation signals such as candlestick patterns, volume analysis, or shifts in market structure. A well-executed Turtle Soup trade can help traders avoid being trapped by false breakouts and instead profit from the price reversal that follows.
Every Turtle Soup setup follows the same core principle: price briefly breaks an important swing high or swing low, captures liquidity, and then quickly reverses back into the previous trading range.
Bullish Setup
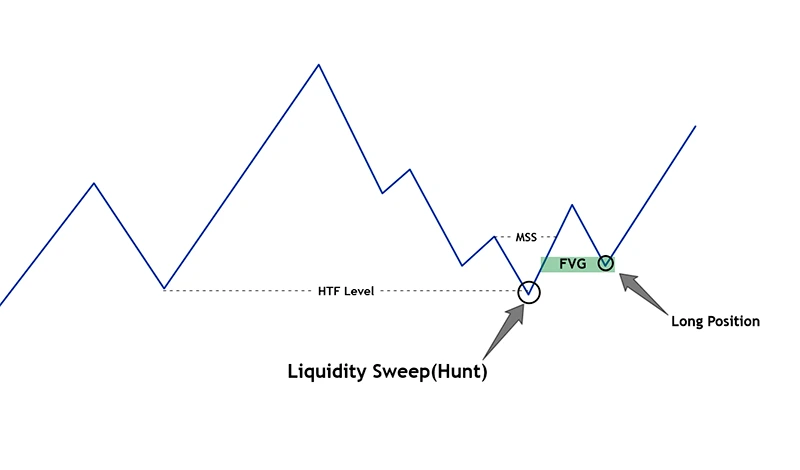
A bullish Turtle Soup setup anticipates a reversal from a downward false breakout, suggesting a potential upward price movement.
Steps to Identify a Bullish Setup:
- Higher Timeframe Analysis: Begin by examining higher timeframes (e.g., daily or 4-hour charts) to identify significant support levels or previous swing lows.
- Mark Sell-Side Liquidity Zones: Identify areas where sell-side liquidity is likely to reside, typically below recent lows where stop-loss orders from long positions may be clustered.
- Monitor for Liquidity Sweep: On a lower timeframe (e.g., 15-minute or 1-hour charts), observe the price action as it approaches and briefly breaches the identified support level, triggering stop-loss orders and capturing sell-side liquidity.
- Confirm Market Structure Shift: After the liquidity sweep, look for a swift price reversal back above the breached support level, indicating a shift in market structure from bearish to bullish.
- Entry Signal: Consider entering a long position once the price closes back above the support level, with confirmation from bullish candlestick patterns or other technical indicators.
Bearish Setup
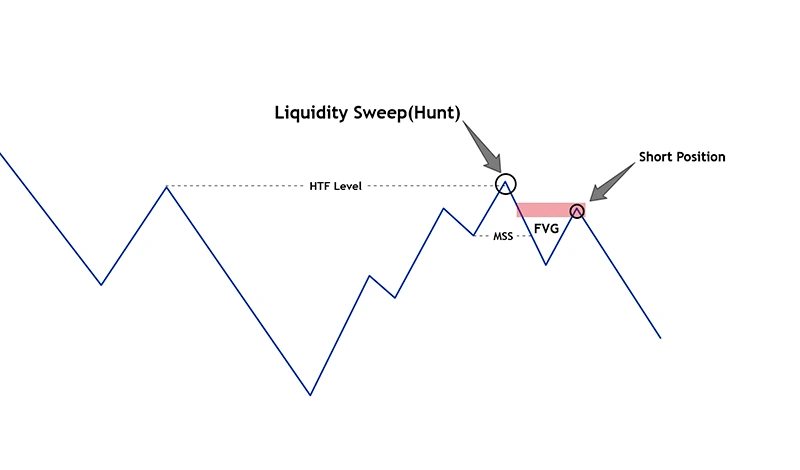
A bearish Turtle Soup setup anticipates a reversal from an upward false breakout, suggesting a potential downward price movement.
Steps to Identify a Bearish Setup:
- Higher Timeframe Analysis: Analyze higher timeframes (e.g., daily or 4-hour charts) to identify significant resistance levels or previous swing highs.
- Mark Buy-Side Liquidity Zones: Identify areas where buy-side liquidity is likely to accumulate, typically above recent highs where stop-loss orders from short positions are clustered.
- Monitor for Liquidity Sweep: On a lower timeframe (e.g., 15-minute or 1-hour charts), observe price action as it approaches and briefly breaches the identified resistance level, triggering stop-loss orders and capturing buy-side liquidity.
- Confirm Market Structure Shift: After the liquidity sweep, look for a swift price reversal back below the breached resistance level, indicating a shift in market structure from bullish to bearish.
- Entry Signal: Consider entering a short position once the price closes back below the resistance level, with confirmation from bearish candlestick patterns or other technical indicators.
| 4 | Look for a rapid reversal back below the resistance, indicating a bearish market structure shift. |
| 5 | Enter a short position upon confirmation, setting stop-loss just above the recent high. |
If you want to learn a more simplified Turtle Soup strategy, please check this video.
Key Differences Between Bullish and Bearish Turtle Soup Setups
| Feature | Bullish Setup | Bearish Setup |
| Target Level | Prior swing low (support zone) | Prior swing high (resistance zone) |
| Liquidity Zone | Sell-side liquidity (below recent lows) | Buy-side liquidity (above recent highs) |
| Market Shift | Bearish to bullish reversal | Bullish to bearish reversal |
| Entry Signal | Break and close back above the support level | Break and close back below the resistance level |
| Stop-Loss | Placed just below the recent low | Placed just above the recent high |
How to Trade Turtle Soup
The Turtle Soup strategy is a structured trading approach that helps traders take advantage of false breakouts, a common occurrence in financial markets. By carefully identifying key levels, monitoring price action, and executing trades with precision, traders can increase their chances of success. Below is a detailed step-by-step guide to implementing the Turtle Soup strategy effectively.
Step 1: Identify Key Support and Resistance Levels
The first step in the Turtle Soup strategy is to identify important price levels where false breakouts are likely to occur. These are typically areas where traders place their stop-loss orders, making them attractive liquidity targets for large market participants.
- Use higher timeframes such as the daily or four-hour chart to locate key swing highs and swing lows that have acted as strong support or resistance in the past.
- Mark these levels clearly on your chart, as they represent areas where price is likely to react.
- Pay attention to price zones where multiple swing points align, as these levels tend to attract more liquidity, increasing the chances of a false breakout.
Step 2: Wait for a False Breakout
Once key levels are identified, the next step is to wait for price to make a move beyond these levels, triggering a false breakout.
- Switch to a lower timeframe, such as the one-hour or fifteen-minute chart, to closely monitor price action as it approaches a marked level.
- A false breakout occurs when price temporarily moves above a resistance level or below a support level but quickly reverses, failing to sustain the move.
- These breakouts often trigger liquidity sweeps, where large orders are executed, hitting stop-losses before price reverses direction.
- Be patient and wait for clear signs of a false breakout rather than preemptively entering a trade.
Step 3: Confirm Market Structure Shift
After detecting a false breakout, traders must confirm a shift in market structure before executing a trade.
For a bullish Turtle Soup setup:
Price breaks below a previous swing low, triggering stop-losses and collecting sell-side liquidity.
It then quickly moves back above the broken support level, indicating that the downward move was a trap.
Look for confirmation signals such as a bullish engulfing candle, a pin bar with a long lower wick, or a sudden increase in buying volume.
For a bearish Turtle Soup setup:
Price breaks above a previous swing high, triggering stop-losses and collecting buy-side liquidity.
It then quickly reverses and moves back below the broken resistance level.
A bearish engulfing candle, a shooting star with a long upper wick, or increased selling pressure can confirm the reversal.
Step 4: Execute the Trade
Once the market structure shift is confirmed, traders can enter their positions accordingly.
- Bullish Entry: Enter a buy trade when price closes back above the swing low after a false breakout. This signals that the market has absorbed the liquidity and is likely to move higher.
- Bearish Entry: Enter a sell trade when price closes back below the swing high after a false breakout. This suggests that the breakout attempt failed and price is likely to decline.
Step 5: Set Stop-Loss and Take-Profit Levels
Proper risk management is essential when trading Turtle Soup setups. Setting appropriate stop-loss and take-profit levels helps protect capital and maximize potential profits.
Stop-Loss Placement:
For a long position, place the stop-loss just below the most recent swing low to minimize risk.
For a short position, place the stop-loss just above the most recent swing high to protect against an unexpected reversal.
Take-Profit Targets:
The first target should be the next significant resistance or support level where price is likely to encounter a reaction.
Using a risk-reward ratio of at least 1:2 or 1:3 ensures that potential gains outweigh possible losses.
Example: Suppose EUR/USD briefly falls below yesterday's swing low before quickly moving back above it. After a bullish confirmation candle forms, a trader could enter a buy position, place the stop-loss below the false breakout low, and target the next resistance level while maintaining at least a 1:2 risk-reward ratio.
Step 6: Manage Risk
Even with a high-probability strategy like Turtle Soup, risk management plays a crucial role in long-term trading success.
- Risk only 1-2% of your total trading capital on any single trade to avoid significant losses.
- Be cautious when trading during high-impact news events, as increased volatility can lead to unpredictable price movements and invalidate false breakout setups.
- Maintain a trading journal to track performance, identify recurring patterns, and refine the strategy over time.
By following these steps, traders can systematically approach the Turtle Soup strategy, increasing their ability to profit from false breakouts while effectively managing risk.
What Timeframe Should You Use for the Turtle Soup?
The effectiveness of the Turtle Soup strategy largely depends on selecting the right combination of timeframes. Since this strategy relies on identifying false breakouts and trading against the crowd, it is crucial to analyze price movements on multiple timeframes to get a clearer picture of market structure, liquidity zones, and potential reversals.
Using a top-down approach, traders can first analyze the broader trend on a higher timeframe and then refine their entries on a lower timeframe. This method helps filter out noise, improves trade accuracy, and increases the probability of a successful setup.
Higher Timeframe (Daily, 4-Hour)
- The daily and 4-hour timeframes are ideal for identifying key support and resistance levels where liquidity is likely to be trapped. These levels act as zones where price often reverses, making them prime locations for Turtle Soup setups.
- By analyzing price movements on these higher timeframes, traders can determine the overall trend direction, helping them align their trades with the broader market structure rather than going against strong trends.
- Significant swing highs and swing lows can be identified on these timeframes, marking areas where price is likely to trigger stop-loss orders before reversing.
- Trading on these timeframes also reduces the impact of market noise, providing a clearer view of liquidity hunts and institutional activity.
Lower Timeframe (1-Hour, 15-Minute)
- Once key levels are identified on higher timeframes, traders shift to the 1-hour or 15-minute chart to fine-tune their entries and confirm false breakouts.
- These shorter timeframes allow traders to monitor price action more closely as it approaches key liquidity zones.
- A false breakout often involves price spiking beyond a significant level before quickly reversing. Observing these movements in real time helps traders catch the setup as it unfolds.
- Entry signals such as reversal candlestick patterns, volume spikes, or rapid rejections become clearer on lower timeframes, allowing for more precise trade execution.
Best Approach
- The most effective way to trade the Turtle Soup strategy is by using a combination of timeframes rather than relying on just one.
- Start by analyzing the daily or 4-hour chart to identify significant support and resistance levels where false breakouts are likely to occur.
- Once a potential setup is found, switch to the 1-hour or 15-minute chart to monitor price action near these levels. Look for false breakouts and confirmation signals before executing a trade.
- This approach provides a balanced perspective, ensuring that traders are trading in alignment with the larger market context while still getting precise entries with reduced risk.
Best Pairs for Turtle Soup Trading
The Turtle Soup strategy works best in highly liquid markets where false breakouts occur regularly, including major forex pairs, gold, stock indices, and selected cryptocurrencies.
Best Forex Pairs
| Pair | Reason |
| EUR/USD | High liquidity, strong trend reversals. |
| GBP/USD | Large price swings, ideal for false breakouts. |
| USD/JPY | Follows technical patterns well. |
| AUD/USD | Clear market structure, reacts to key levels. |
Commodities & Indices
| Market | Reason |
| Gold (XAU/USD) | High volatility, clear swing points. |
| S&P 500 (SPX) | Frequent false breakouts at key levels. |
| NASDAQ (NDX) | Momentum-driven, good for ICT strategies. |
Pairs with high liquidity and well-defined support/resistance levels work best for Turtle Soup trading.
Potential Advantages and Limitations
Advantages
✔ Exploits Market Inefficiencies: Takes advantage of false breakouts and liquidity sweeps.
✔ Clear Entry and Exit Points: Defined levels allow for precise trade execution.
✔ Works Across Multiple Markets: Effective in forex, commodities, indices.
✔ Avoids Trend Chasing: Contrarian approach reduces false trend-following signals.
Limitations
❌ Requires Experience: Identifying false breakouts takes practice.
❌ Not Effective in Strong Trends: Works best in range-bound markets.
❌ Time-Intensive: Requires moniIf breakout continues instead of reversing, losses can occur.
❌ Confirmation Is Essential: Entering before the false breakout is confirmed increases the risk of being caught in a genuine breakout instead of a reversal.
Frequently Asked Questions (FAQ)
Q1: Is the Turtle Soup strategy suitable for beginners?
Not ideal for complete beginners.
- Requires understanding of price action and liquidity concepts.
- New traders should backtest the strategy before live trading.
Q2: Can I automate the Turtle Soup strategy?
Yes, but with caution.
- Some traders use algorithmic trading for false breakout detection.
- However, manual confirmation of liquidity grabs is preferred.
Q3: What’s the ideal stop-loss placement?
- For long trades, below the recent swing low.
- For short trades, above the recent swing high.
Q4: Can the strategy be used on stocks and crypto?
Yes.
- Works well on high-volume stocks (AAPL, TSLA).
- Effective in crypto (BTC, ETH) due to liquidity traps.
Q5: How do I avoid getting caught in real breakouts instead of false ones?
- Higher timeframe analysis helps identify genuine trends.
- Look for signs of liquidity sweeps instead of clear momentum breakouts.
Q6: Does the Turtle Soup strategy work in trending markets?
Turtle Soup generally performs best in ranging or slowing markets where false breakouts occur more frequently. In strong trending markets, traders should wait for additional confirmation because genuine breakouts are more likely to continue than reverse.
返回 返回
