What is a hanging man candle, and what does it signal?
Short answer: A hanging man candle is a potential bearish reversal pattern that forms after a price advance. It has a small body near the top of its range, a long lower wick and little upper wick. Traders watch for subsequent selling to confirm weakness before considering a short position.
Key takeaways
- A hanging man matters after an upward move; the same shape after a decline is usually called a hammer.
- The lower wick is commonly at least twice the body length, with little or no upper wick.
- Both red and green candles can qualify. Colour alone does not confirm a reversal.
- Entry, stop loss, position size and trading costs determine whether a setup is practical.
What is the Hanging Man Candlestick Pattern?
The hanging man candlestick pattern is a single-candle formation that warns of possible weakness following a rally. Its name describes its appearance: a small body sits above a much longer lower shadow. The preceding advance distinguishes it from other candles with similar proportions.
Its practical value is to identify a moment when an established upward move deserves closer attention. Sellers pushed price substantially below the opening area during the candle, although buyers recovered much of that decline before the close.
That recovery leaves an unresolved question: will buyers maintain control during the next period? A hanging man identifies a candidate reversal area, but the candle itself does not answer that question.
For someone holding a long position, it can prompt a review of an existing exit plan. For someone considering a short, it creates a setup to evaluate alongside resistance and subsequent price action.
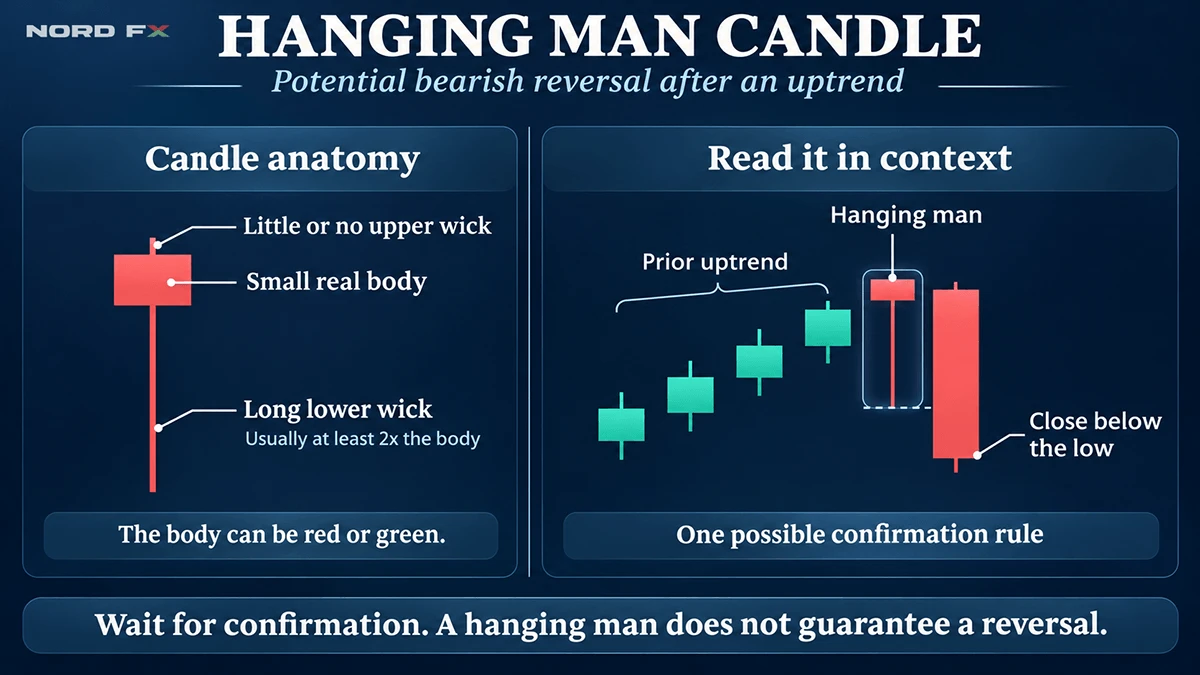
Structure of Hanging Man
The real body represents the distance between the opening and closing prices. The lower wick extends from the lower edge of that body to the candle's low. The upper wick connects the higher body edge to the high.
A conventional hanging man has a small body in the upper part of its range, a lower wick at least twice the body's length, and a very short or absent upper wick. These proportions are recognition guidelines, not a formula for predicting returns.
When the open and close are almost identical, classification becomes less clear because the candle may resemble a doji. Avoid forcing borderline shapes into a strict strategy simply because the later move looks attractive.
How to Identify the Hanging Man Pattern
Start with the preceding price movement. Look for an upward swing, such as a sequence of higher highs and higher lows. A matching candle in the middle of sideways trading provides little evidence of a bearish reversal.
Next, examine the completed candle's proportions. An unfinished candle can change shape before its closing time, so it cannot yet satisfy a rule based on its final body and wicks.
Then assess location. A formation near a previously identified resistance area gives you a level against which to evaluate subsequent trading. A new high can also become a potential turning point, but it should not be described as established resistance before the market has reacted there.
Finally, define confirmation. A close below the hanging man's body indicates follow-through; a close below its low is a stricter condition. Those rules produce different entries and should be tested separately.
The bearish case weakens if price holds above the body and resumes making highs. Recognition should lead to a conditional plan, with clear reasons to proceed or stand aside.
Is the Hanging Man a Bullish or Bearish Pattern?
The hanging man is classified as a bearish reversal pattern because it appears after an advance and warns that selling pressure may be increasing. Its body can be red or green. A green close does not turn it into a bullish pattern.
Location and wick direction distinguish the closest alternatives:
Pattern | Typical location | Main structural feature | Interpretation |
Hanging man | After an advance | Small upper body, long lower wick | Potential bearish reversal |
Hammer | After a decline | Small upper body, long lower wick | Potential bullish reversal |
Shooting star | After an advance | Small lower body, long upper wick | Potential bearish reversal |
Dragonfly doji | Depends on context | Open and close nearly equal near the high | Context-dependent rejection of lower prices |
The hammer candlestick pattern shares the hanging man's basic shape. The shooting star pattern shares its potential bearish implication but shows rejection at the opposite end of the candle.
Market Psychology Behind the Hanging Man
During an advance, traders have been willing to buy at progressively higher prices. A hanging man shows that a substantial downward excursion occurred within one period, interrupting that upward progress.
The long lower wick records trading below the body. The close near the top shows that those lower prices were not sustained. This creates tension between emerging selling pressure and the buyers who absorbed it.
A candle alone cannot reveal whether that selling came from profit-taking, new short positions or a news response. It also does not show the exact sequence of every price movement within the period. Those explanations remain hypotheses unless supported by additional data.
If subsequent candles close lower, the recovery has failed to produce continued upside. Buyers entering near the high may then face losses, potentially adding selling pressure if they exit.
If price instead advances above the formation, the recovery may have reflected continuing demand. This is why a long lower wick requires context and follow-through before it supports a bearish trade.
How to Trade the Hanging Man Pattern
Trading the hanging man requires rules for confirmation, entry, invalidation and exit. The following approaches are educational examples that need testing on the chosen instrument.
Choose an entry rule
One approach is to wait for a candle to close below the hanging man's body, then evaluate a short entry. This responds to initial weakness but may trigger before the pattern's low breaks.
A stricter approach waits for a close below the low. It demands more downward movement before entry, but that delay can leave less distance to the next support level.
Another approach uses a sell-stop order below the pattern's low after the hanging man closes. This enters on a break rather than waiting for a confirming close. A brief spike can trigger it, and execution may differ from the order price.
Choose the rule in advance. Switching between methods after seeing the outcome makes performance comparisons unreliable.
Define the stop and position size
For a short setup, one possible invalidation area is above the hanging man's high or the surrounding swing high. Allowance for volatility and execution conditions should be part of the tested rule. A stop placed just above the body can be reached while the broader formation remains intact.
Calculate position size from the planned loss. For example, a hypothetical $2,000 account allocating 0.5% to one trade has a $10 risk budget. With a 40-pip stop, the price-movement allowance is $0.25 per pip before costs. The corresponding lot size depends on the instrument and account currency.
The NordFX trading calculator estimates position size, pip value and required margin from the selected inputs. Check contract specifications and leave room for costs. Slippage can make the realised loss exceed the amount planned at the stop.
Evaluate targets and costs
Identify support visible before entry, then compare the available downside with the stop distance. A hypothetical 40-pip risk and 80-pip target gives a risk-to-reward ratio of 1:2 before costs. Understanding risk-to-reward ratios helps assess whether the remaining opportunity justifies the exposure.
There is no separate price for trading the pattern itself. The relevant costs come from the instrument and account: spread, commission where applicable, and overnight financing when a position crosses rollover. Financing can be a debit or credit. Execution differences can also affect the result, as explained in this guide to how trading costs affect profit.
Decide when to skip
Stand aside when nearby support leaves insufficient room, confirmation arrives after most of the decline, or the required stop exceeds your risk budget even at the minimum position size. A recognisable candle does not create an obligation to trade.
Trading Tips for the Hanging Man Candle Pattern
Use the higher timeframe to understand what the potential reversal would mean. An hourly hanging man might mark a small pullback within a daily uptrend. That context affects expectations for the target and holding period.
Check scheduled announcements before entering. If a setup requires execution during a major release, wider spreads or abrupt price changes may make the planned entry and stop assumptions unrealistic.
Keep supporting evidence focused. Resistance, momentum and volume answer different questions, but adding several indicators derived from the same price series does not create several independent confirmations. Volume on a spot currency platform may represent tick activity from that feed rather than total market trading volume.
Set an expiry rule for untriggered setups. For example, a test could cancel a pending entry after three candles or after a new high. These are illustrative rules to evaluate, not universal settings. Keeping an old signal active indefinitely changes the original trading idea.
Advantages of Hanging Man Candle
The pattern is easy to describe using observable prices. This makes it suitable for practising a repeatable analysis process: identify the preceding advance, measure the candle, then record what happens next.
It also provides reference points for risk planning. The candle's high and low help define what would confirm or contradict the setup, although the appropriate stop may depend on a wider swing.
The hanging man can serve different purposes. A trader managing an existing long position may use it as a prompt to reassess exposure, while another may investigate a new short setup. Neither response needs to be automatic.
It fits a trading process that allows time to wait for closed candles and compare potential reward with risk. Its simplicity also makes journalling manageable: screenshots and a few numerical measurements can preserve the reasoning behind each decision.
Disadvantages of Hanging Man Candle
The main limitation is ambiguity. Buyers recovered during the candle, and that recovery can continue. Selling immediately because a hanging man appears can mean entering against a trend that remains strong.
Confirmation introduces a trade-off. Waiting can provide more evidence of weakness, while moving the entry farther from the high. The resulting stop may be wider and the remaining target smaller.
Identification can also vary between traders and charting tools. Different definitions of a small body, acceptable upper wick and preceding trend produce different sets of signals. Candle boundaries can differ between data feeds, particularly on four-hour and daily charts.
The pattern is poorly suited to someone seeking guaranteed reversals, unattended entries without tested rules, or conclusions based only on memorable examples. It also supplies no profit target by itself. Support, volatility and the wider market structure must inform that decision.
Example of a Hanging Man Candlestick used in Trading
The USD/CHF four-hour chart shows a rise from the lows around 22 October 2026 into a local high around 28 October. The yellow rectangle highlights the area where that advance stalls near the marked 0.83029 level.
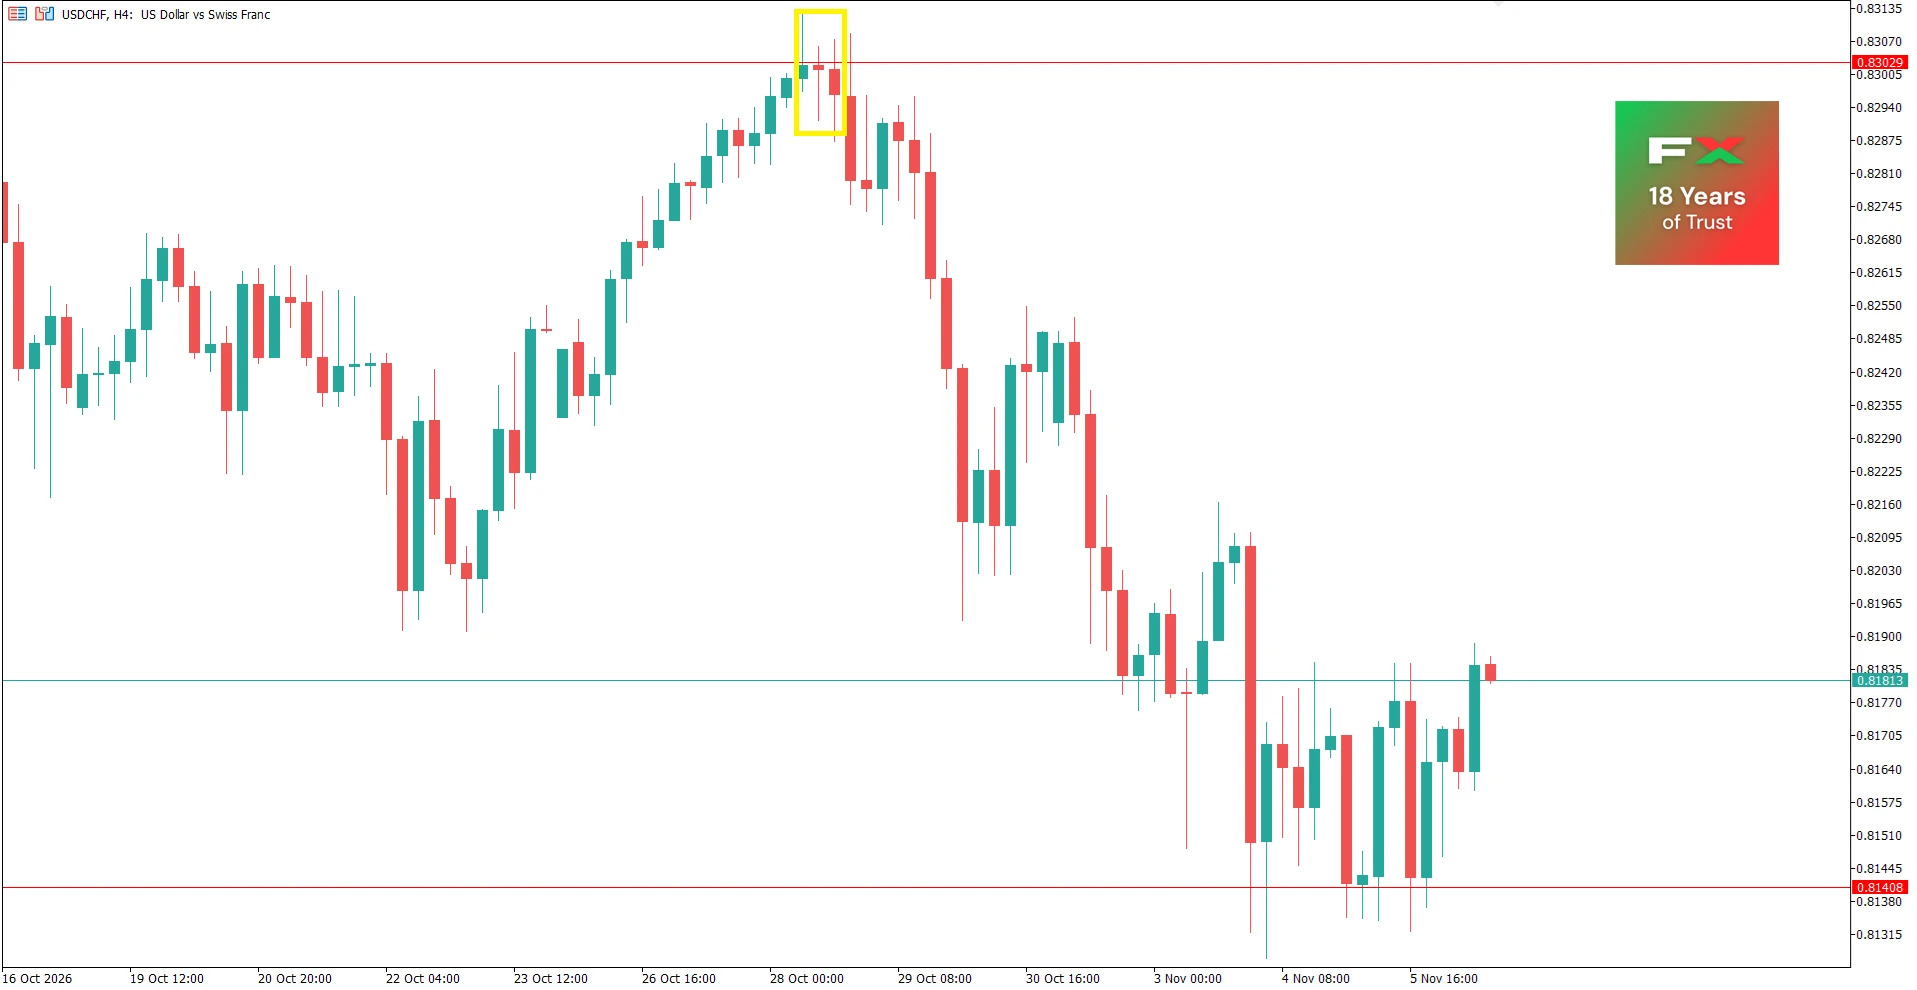
Within the rectangle, the small red candle has a lower wick substantially longer than its body. It also has a visible upper wick and a very small body, so it is an imperfect hanging man example with some doji-like characteristics. A strict screening rule might exclude it.
Reading the sequence
The upward move before the highlighted area establishes the context. Later bearish candles move below the small candle's body and then below its low, supporting the reversal interpretation. Price subsequently declines towards the 0.818 area and later trades around the marked 0.81408 level.
An illustrative trade calculation
To demonstrate the arithmetic, assume a hypothetical short entry at 0.8280 after bearish follow-through, a stop at 0.8315 above the highlighted swing, and a target at 0.8210 near an earlier trading area.
Trade element | Illustrative value | Calculation or purpose |
Short entry | 0.8280 | Assumed entry after bearish follow-through |
Stop loss | 0.8315 | Above the highlighted swing high |
Planned price risk | 35 pips | 0.8315 minus 0.8280 |
Target | 0.8210 | Example of an exit near an earlier trading area |
Potential price reward | 70 pips | 0.8280 minus 0.8210 |
Risk-to-reward ratio | 1:2 | Before trading costs and execution differences |
For USD/CHF, one pip is 0.0001. The example therefore risks 0.0035 to seek 0.0070. Cash outcomes depend on position size and the conversion of CHF profit or loss into the account currency.
How Accurate is the Hanging Man Candlestick in Technical Analysis?
There is no single accuracy percentage that applies to every hanging man setup. Any useful figure needs a stated instrument, timeframe, sample period, recognition rule and definition of success.
For example, counting whether price falls at all after the candle answers a different question from whether a short trade reaches its target before hitting its stop. A temporary decline may satisfy the first test while the trade still loses money.
Measure the complete strategy
Record every qualifying setup in a defined sample, including failures. Apply the same confirmation, entry, stop, target and expiry rules. Include realistic costs and test the approach on a separate period that was not used to choose the rules.
Win rate should be considered alongside average win, average loss and drawdown. In a hypothetical strategy with a 40% win rate, an average gross win of 2 risk units and an average loss of 1, expectancy is 0.2 risk units per trade before costs: 0.4 multiplied by 2, minus 0.6 multiplied by 1.
What is the Best Timeframe to Trade using Hanging Man?
There is no universally best timeframe. The appropriate choice depends on the intended holding period, available monitoring time and results obtained with consistent rules.
Four-hour and daily charts are practical starting points for studying the pattern because they require fewer decisions than very short charts. However, wider candle ranges can require wider stops and smaller positions. Overnight exposure may also introduce financing costs and gap risk.
Hourly or 15-minute charts may suit an intraday testing process, but spreads and execution differences can consume a larger share of a small target. Faster signals also demand more frequent monitoring.
Use the higher timeframe for context and the chosen trading timeframe for the actual trigger. A bearish candle on H4 does not establish a daily trend reversal. Compare timeframes using results after costs rather than assuming that a slower chart is automatically more accurate.
FAQs
Can a hanging man candle be green?
Yes. A green body means the candle closed above its open. The potential bearish interpretation comes from its shape and position after an advance, with subsequent weakness needed to support the setup.
What is the difference between a hanging man and a hammer?
They share a small upper body and long lower wick. A hanging man follows an advance, while a hammer follows a decline. Their different locations create opposite potential reversal interpretations.
Does the lower wick have to be exactly twice the body?
No. Twice the body length is a common minimum guideline, not an exact required ratio. Define a consistent threshold for testing and consider the upper wick and preceding trend as well.
Does a hanging man always signal a major reversal?
No. It can precede a brief pullback, sideways trading or continued gains. A larger trend reversal requires additional evidence from subsequent market structure.
Is a break below the low enough to enter?
It can be an entry trigger in a predefined strategy. A brief break can also reverse before the candle closes. Compare break-based and close-based rules separately, including their execution costs and missed trades.
Can an indicator detect hanging man candles automatically?
Yes, indicators can scan for specified body, wick and trend conditions. Different settings can label different candles. Automated detection helps locate candidates, but it does not establish profitability or replace entry and risk rules.
By John Gordon, Market Analyst at NordFX
Go Back Go Back
