What is the double top pattern?
Short Answer: A double top pattern is a potential bearish reversal formation in which price reaches a similar high twice after an uptrend, with a pullback between the peaks. Traders generally consider it complete when price breaks below the intervening low, called the neckline. Confirmation supports a bearish interpretation but does not guarantee a decline.
Key takeaways:
- Two similar highs create a potential setup; a neckline breakdown completes the classical pattern.
- The peaks need not match exactly, but the intervening pullback should be clearly visible.
- Entries, stops and targets must be evaluated together before opening a position.
- Spreads, commissions, financing and slippage can change whether a trade is worth taking.
- A double top suggests a bearish reversal; a double bottom suggests a bullish reversal.
What is the double top pattern?
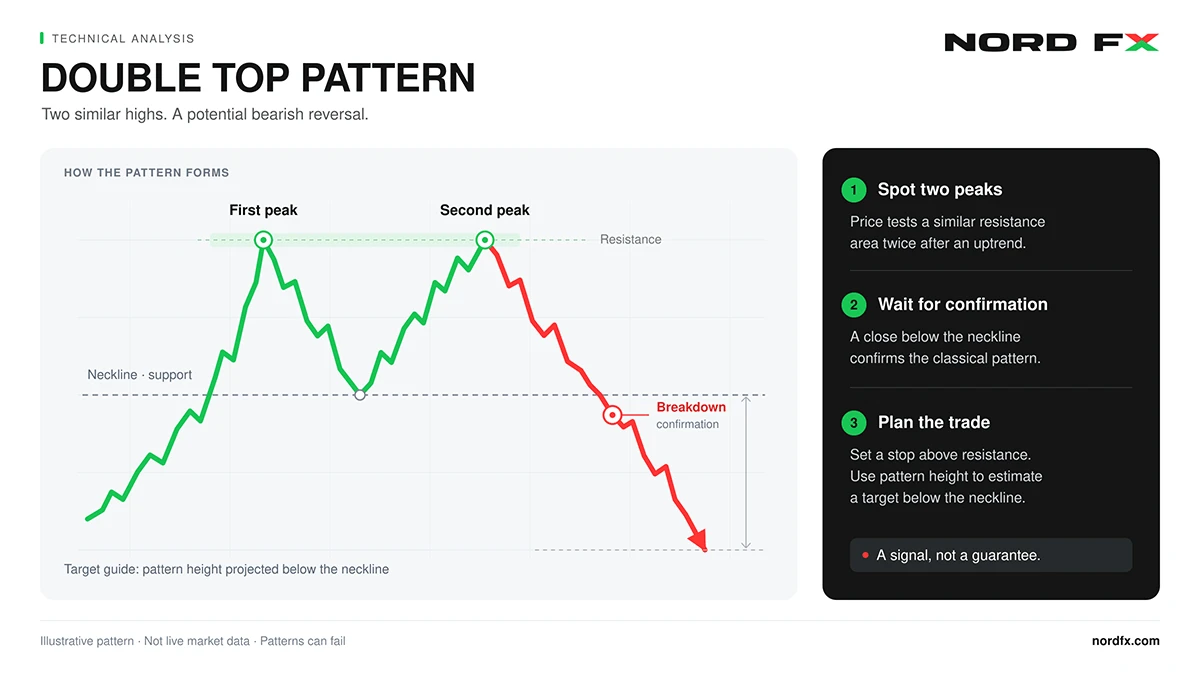
The double top chart pattern is an M-shaped formation that develops when an advancing market makes two unsuccessful attempts to sustain higher prices around the same resistance area. The low separating those attempts becomes the neckline.
Imagine price climbing to 100, retreating to 95, and then returning to approximately 100. At this stage, there are two peaks, but support at 95 remains intact. A subsequent break below 95 completes the traditional bearish formation.
This distinction matters because repeated resistance tests also occur during consolidations that eventually break upward. Identifying the shape is only the beginning of the analysis.
The pattern can appear on candlestick, bar or line charts. Although traders sometimes call it a double top candlestick pattern, it usually develops across many candles. It is not a specific two-candle formation.
Its practical purpose is to organise decisions around observable price levels: where buying has stalled, where support has failed, and where the bearish interpretation would need reassessment.
How to identify a double top pattern
Look for an existing uptrend, two distinct peaks near the same resistance zone, and a meaningful trough between them. Then distinguish an unfinished formation from one that has broken its neckline.
Establish the trend and resistance area
Start with the price movement leading into the first peak. A reversal pattern needs a trend to reverse. Two highs inside a prolonged sideways range may simply mark the range boundary.
Assess the pattern on the timeframe you intend to trade, then inspect a higher timeframe for context. A four-hour double top might develop beneath a daily resistance zone, or it might sit within a strong daily uptrend. These situations create different trading conditions.
For example, if the daily chart remains in an uptrend and has support immediately below a four-hour neckline, a short trade would be targeting a smaller countertrend move. That context may justify a nearer exit or no entry; it does not turn the double top into a bullish formation.
Mark resistance as an area rather than insisting on identical prices. The second peak may fall slightly below the first or briefly rise above it before reversing. What matters is whether both peaks represent tests of the same area.
Find a distinct pullback and neckline
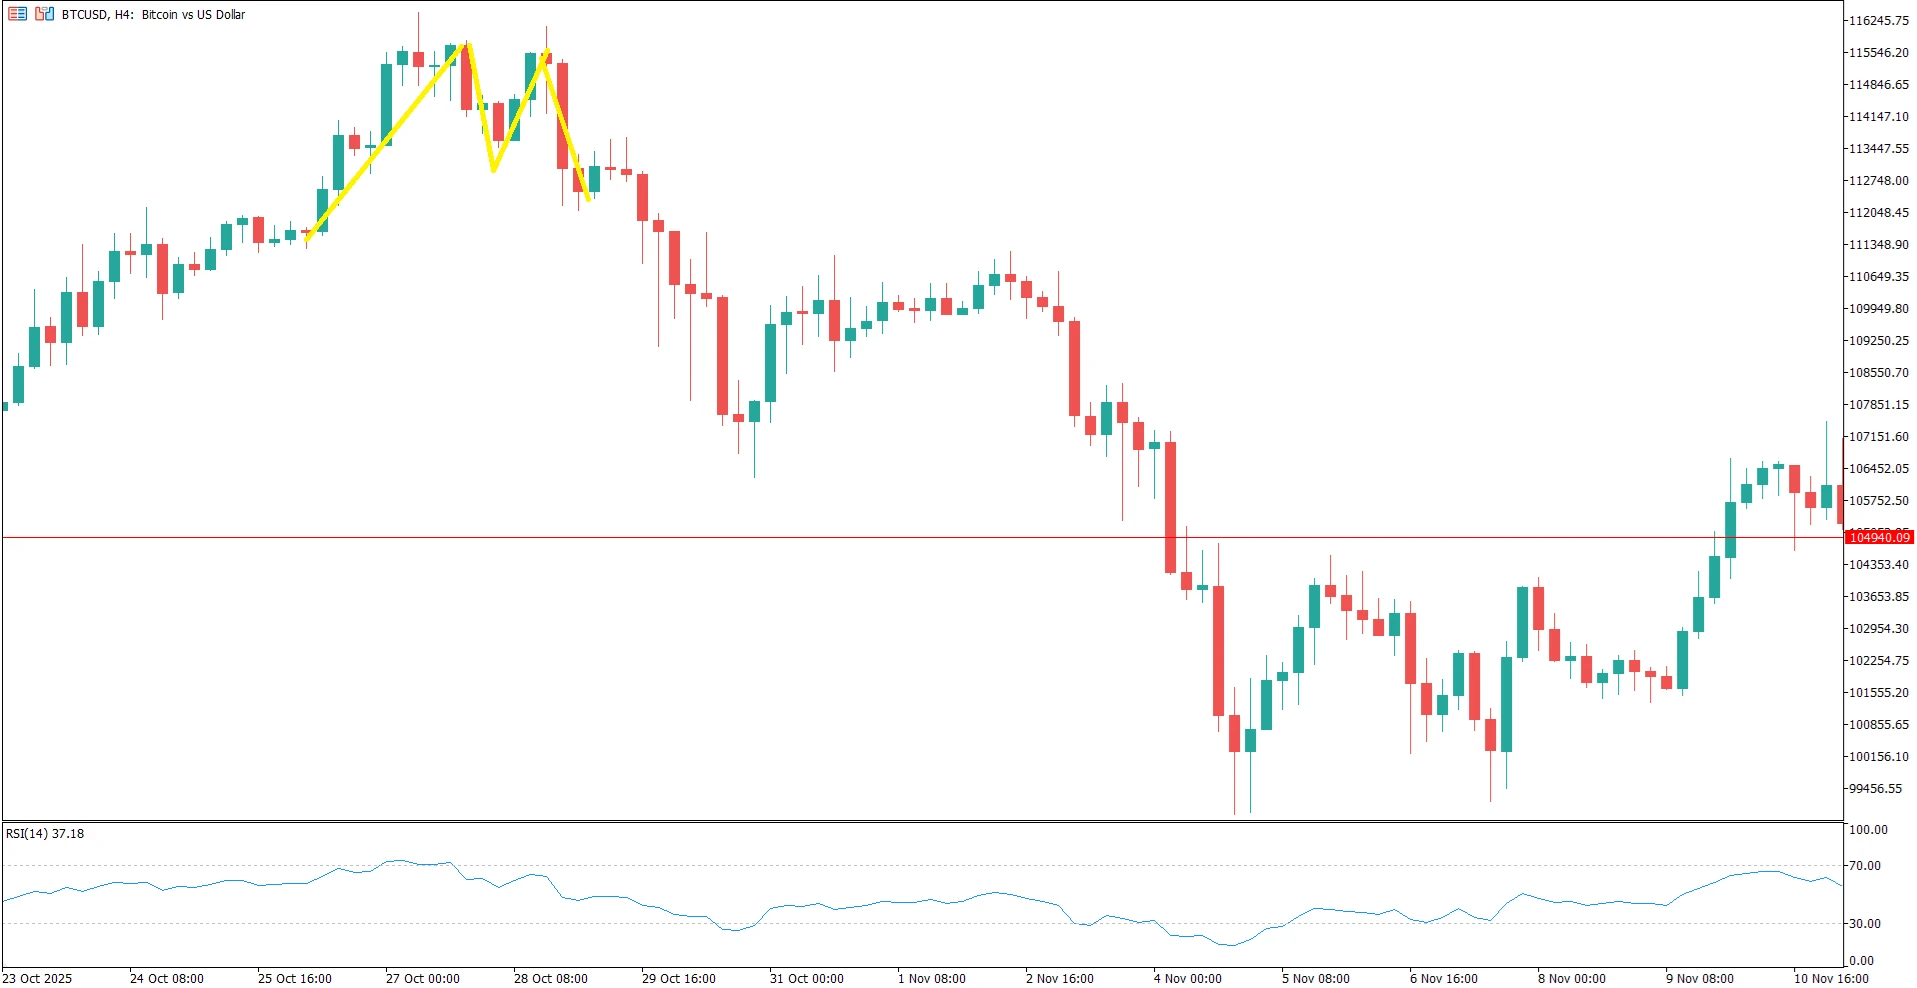
The pullback should create a recognisable swing low between the peaks. Two adjacent candles with similar highs and almost no retracement are insufficient evidence of a developed double top.
Draw the neckline through the intervening low. If the trough includes several nearby lows, use a narrow support zone and define its boundaries consistently. The relationship between support and resistance levels also explains why a broken neckline may later resist a recovery.
There is no universal minimum number of candles or fixed percentage difference allowed between the tops. A workable identification rule should reflect the instrument’s volatility and remain consistent across historical and live examples.
Define confirmation before the break
One practical rule is to require a candle close below the neckline on the pattern’s timeframe. For a four-hour setup, a brief five-minute move beneath support does not satisfy that rule.
Closing beyond support filters out some temporary breaches, but it also delays entry. A large breakdown candle may leave little room before the next support area.
Volume and momentum can provide context. Lower participation near the second peak or stronger activity during the breakdown may support the bearish interpretation. However, tick volume reflects activity in a particular feed, not total market-wide trading volume. RSI divergence can suggest weakening momentum, but it can persist without a reversal.
What does the double top pattern mean?
A double top suggests that an uptrend may be losing strength and that sellers may be gaining influence. The neckline break matters because price has moved beneath the support created during the first pullback.
Before that break, buyers have still defended the intervening low. Afterward, the market has failed to preserve that part of its previous structure.
The familiar explanation is that buyers struggle near resistance, some existing holders take profits, and selling pressure increases as support gives way. This is an interpretation of price behaviour, not proof of particular traders’ intentions. The chart alone cannot show why every participant bought or sold.
Several outcomes remain possible. Price may decline immediately, return to test the neckline from below, or recover into the previous range. A retest is an opportunity to reassess the level; it is not a required stage.
A sustained recovery above the neckline weakens a breakdown trade. A sustained move above the peaks undermines the broader reversal thesis. The exact exit condition should already be part of the trading plan.
For someone holding a long position, the formation may prompt a review of exposure or exit rules. Recognising bearish evidence does not automatically require opening a short trade.
How to trade the double top
To trade a double top, define the confirmation rule, choose an entry method, place the stop at a meaningful invalidation level, and compare the realistic target with the planned loss and costs. Calculate position size only after establishing those prices.
The following process illustrates how to trade a double top pattern without assuming that every completed formation deserves a position.
Choose between a breakdown entry and a retest entry
A breakdown approach enters after price meets the predefined confirmation rule. For example, a trader might sell after a candle closes beneath the neckline, provided the next available price still offers acceptable potential reward relative to risk.
A sell-stop order below support is another method, but it can trigger before the candle closes. These are different entry rules and should not be treated as interchangeable.
A retest approach waits for price to return toward the broken neckline and then show renewed rejection. An illustrative trigger could be a candle that trades into the former support area but closes back beneath it.
Waiting may provide a higher short-entry price and a nearer structural stop. However, the market may never retest, or it may recover through the neckline. Neither entry style is automatically superior.
Selling near the second peak anticipates the reversal before confirmation. That is an aggressive resistance trade with different assumptions, even if the chart later becomes a completed double top.
Match the stop to the trade thesis
A stop-loss above the upper resistance zone allows more room for fluctuations but can create a large risk distance. A stop above a lower retest high may reduce that distance, although it is easier for a rebound to reach.
These stops protect different ideas. A retest trade can fail while the broader double top remains technically plausible. Do not move its stop above the original peaks simply to keep the position open.
Allow for normal volatility and the instrument’s quoting conventions. A short position is generally opened at the bid and closed at the ask, so a bid-only chart may not display the exact price that triggers its stop.
Ordinary stop-loss orders do not guarantee the requested execution price. Understanding slippage in trading is particularly relevant around announcements, gaps and thin liquidity.
Calculate the target and assess the price logic
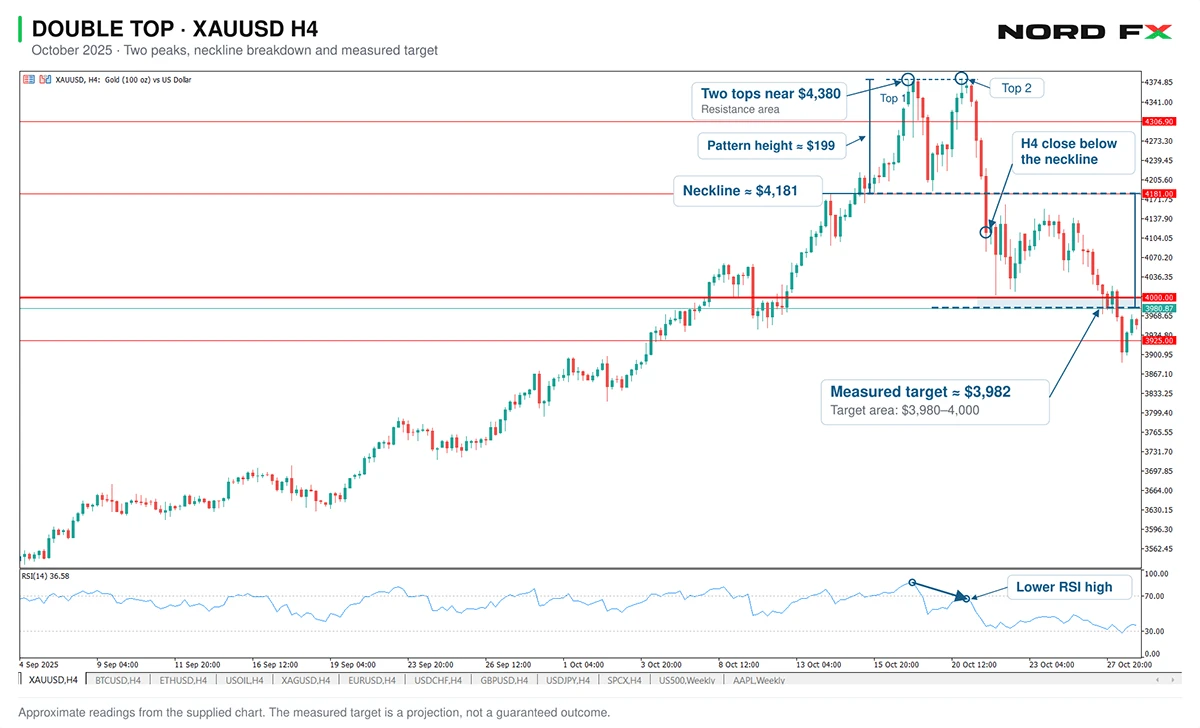
The XAUUSD H4 chart from October 2025 shows gold forming two peaks near $4,380 after a strong uptrend. The pullback between them established support around $4,180–4,190, close to the marked $4,181 level. This area forms the pattern’s neckline.
The measured target comes from projecting the distance between the peaks and the neckline downward from the neckline. Using the approximate peak level of $4,380 and the marked neckline at $4,181:
Pattern height ≈ $4,380 − $4,181 = $199 per ounce.
Projected target ≈ $4,181 − $199 = $3,982.
This places the projection just below the existing $4,000 level. A practical area to monitor was therefore approximately $3,980–4,000. Because the peak reference is rounded and support operates as an area, the calculation should not be treated as an exact execution price.
Confirmation came when a large bearish four-hour candle closed below the neckline. The chart does not show a clear return to that neckline afterward. Price initially approached $4,000, rebounded, and subsequently fell through the projected target area, continuing toward $3,925 and below. That later extension does not change the original measured target.
The chart also illustrates the cost of waiting for confirmation. By the close of the large breakdown candle, gold was already near $4,110. Much of the move from the neckline had therefore occurred, leaving less distance to the projected target. Meanwhile, a stop above the two peaks would remain substantially farther away. A completed pattern does not automatically provide an attractive entry: the remaining potential reward must be assessed against the stop distance from the price actually available.
The RSI panel provides another observation. Although gold returned to approximately the same price high, RSI formed a lower high at the second peak. This bearish divergence suggested weakening upward momentum, while the subsequent neckline breakdown provided price confirmation.
Decide when the setup fits—and when to pass
The approach may fit a trader who can identify clear swing structure, monitor the selected timeframe and follow predetermined exits. It becomes less useful when the neckline is ambiguous, nearby support restricts the target, or costs consume much of the expected movement.
Avoid chasing a decline that has already reached the planned target area. A missed entry is not a reason to invent a more distant target.
Before entering, decide how to respond to a neckline recovery, whether to take profit at an intermediate level, and whether any trailing stop will be used. If price stalls, follow a predefined time-based exit rule if your strategy includes one.
Test the same rules on historical examples and a demo account, including failed patterns. Record entries, costs and exits so that an attractive chart does not substitute for evidence about the strategy.
When reviewing past charts, hide the candles that follow each candidate. Decide whether you would have recognised and traded it using only information available at that moment. Record skipped setups as well as executed ones. This helps distinguish a repeatable decision rule from identifying successful reversals after the event.
Advantages of double top pattern
The pattern’s main advantage is that it connects a visual formation with specific decision points. The trader can distinguish resistance, confirmation, invalidation and a possible target before committing capital.
It also encourages conditional thinking. Instead of declaring that a market must fall because it looks expensive, the trader can specify what price must do before a bearish position becomes eligible.
Another benefit is adaptability. The structure can be assessed across currencies, stock CFDs, indices and other markets, although contract specifications, trading hours and execution conditions differ. The same visual concept does not imply identical trading rules.
It can support decisions beyond short entries. Traders already holding long positions may use the developing pattern to reassess whether their original exit plan remains appropriate.
Finally, a clearly defined version is testable. Rules for peak separation, neckline confirmation and trade management can be documented and reviewed. This makes it easier to identify whether poor results arise from the setup definition, entry timing, costs or inconsistent execution.
Disadvantages of double top pattern
The main disadvantages are false breakdowns, subjective identification and potentially unattractive entries after confirmation. A recognisable M shape does not establish a profitable trading edge.
A neckline break may reverse quickly, leaving short sellers positioned against a recovery. Waiting for a close or retest changes the timing but cannot eliminate this risk.
Identification can also become selective. Traders may label successful examples as textbook patterns while dismissing losing examples as imperfect. Without rules established beforehand, historical review can exaggerate how useful the formation appears.
Confirmation has a price. Entering after a sharp decline can reduce the remaining target distance while leaving the logical stop far above entry. Tightening the stop solely to manufacture an appealing ratio does not improve the underlying structure.
A further limitation is that the measured target ignores new information. Economic releases, earnings and sudden changes in liquidity can alter price behaviour before the projection is reached.
The pattern has no single dependable win rate across all markets and timeframes. Results depend on the definition, execution, costs and exit method. Evaluate both average wins and average losses, since a strategy can win frequently and still lose money overall.
Double top vs double bottom patterns: what is the difference?
A double top is a potential bearish reversal after an advance, while a double bottom is a potential bullish reversal after a decline. Their structures are broadly mirrored, but their confirmation levels break in opposite directions.
Feature | Double top | Double bottom |
Usual preceding trend | Uptrend | Downtrend |
Appearance | M-shaped | W-shaped |
Repeated test | Resistance near two highs | Support near two lows |
Neckline | Low between the peaks | High between the troughs |
Classical confirmation | Break below the neckline | Break above the neckline |
Typical directional trade | Short | Long |
Measured projection | Pattern height below neckline | Pattern height above neckline |
Main failure concern | Recovery above neckline and peaks | Decline below neckline and lows |
The double bottom pattern requires the same discipline: two tests alone do not complete the reversal signal.
Do not assume mirrored shapes produce identical results. Upward and downward moves can differ in speed, volatility and execution conditions. Test long and short strategies separately rather than transferring performance expectations from one to the other.
FAQ
Is double top pattern bullish?
No. A confirmed double top is conventionally a bearish reversal pattern. Before the neckline breaks, the formation remains incomplete, and price can still break upward. An eventual rally represents failure of the bearish setup rather than bullish confirmation of the double top.
What comes after a double top pattern?
A completed double top may be followed by a decline, a neckline retest or a failed breakdown. There is no mandatory sequence after confirmation. Use the trading plan to respond to actual price movement rather than assuming a retest or measured target must occur.
What is a double top candlestick pattern?
The term usually describes a double top visible on a candlestick chart. It consists of two swing highs separated by a pullback and normally develops across multiple candles. Two candles with similar highs alone do not establish the full chart pattern.
How to trade a double top?
A common approach is to wait for a neckline breakdown, then enter after confirmation or a failed retest. Define the stop, realistic target and position size before trading. Check whether potential reward remains sufficient after costs, and skip the setup if it does not meet the strategy’s rules.
Do the two tops have to be exactly equal?
No. Both peaks should test approximately the same resistance area, but small differences are normal. Judge the difference relative to the chart’s volatility and pattern height. If the peaks occupy clearly different price zones, reconsider whether the double-top label is useful.
What is the best timeframe for a double top?
There is no universally best timeframe. Higher timeframes contain fewer candles per session and often require wider stops and longer holding periods, while lower timeframes demand faster monitoring and greater attention to costs. Choose a timeframe that fits the strategy and test its results independently.
By John Gordon, Market Analyst at NordFX
Go Back Go Back
