Every trader searches for reliable signals that cut through the noise of the markets, and few chart formations stand out as clearly as the flag pattern. Resembling a small pause on the battlefield of price action, the flag pattern captures a brief consolidation before momentum charges forward again. Whether in forex, stocks, or cryptocurrencies, understanding this formation can unlock high-probability setups, sharper entries, and better exits for traders at any level.
Key Takeaways
- Flag patterns denote a pause in a strong trend, offering clearer entry and exit points.
- Composed of a sharp ‘flagpole’ followed by a sloped or rectangular ‘flag’ running counter—bullish or bearish continuation.
- Volume behavior—spike on the pole, drop during flag, rise at breakout—boosts awareness and risk validation.
- Applicability across time frames allows flexibility, though identification criteria must remain precise.
- Used effectively in trend trading, yet subject to false breakouts if not confirmed.
Table of Contents
Understanding the Mechanics of Flag Patterns
Why is Flag Pattern important in Technical Analysis?
Different Types Of Flags You Should Keep An Eye Out For
How are Flag Patterns Used by Traders?
What Time- Frame is Best to Trade a Flag Pattern?
Strategies for Trading Flag Patterns
What type of indicator can be used with a Flag Pattern?
How to manage risk when trading the Flag Pattern?
Advantages and Disadvantages of Flag Patterns
Recognizing The Risks Associated With Trading Flag Patterns
What Happens After a Flag Pattern?
🔗 What
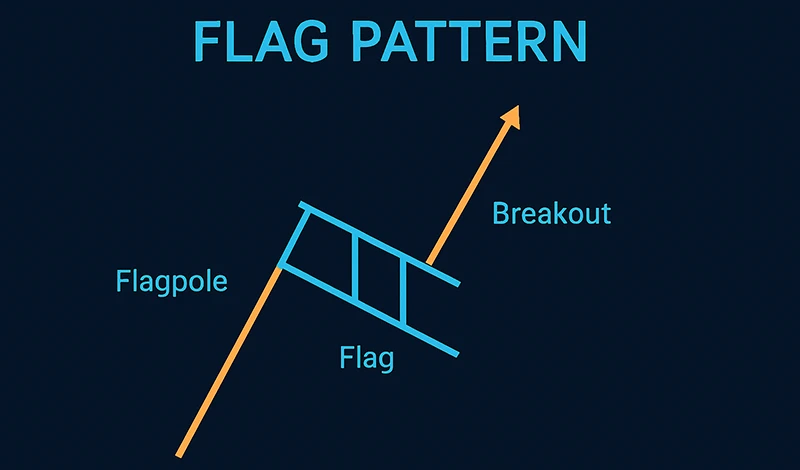
What Is a Flag Pattern?
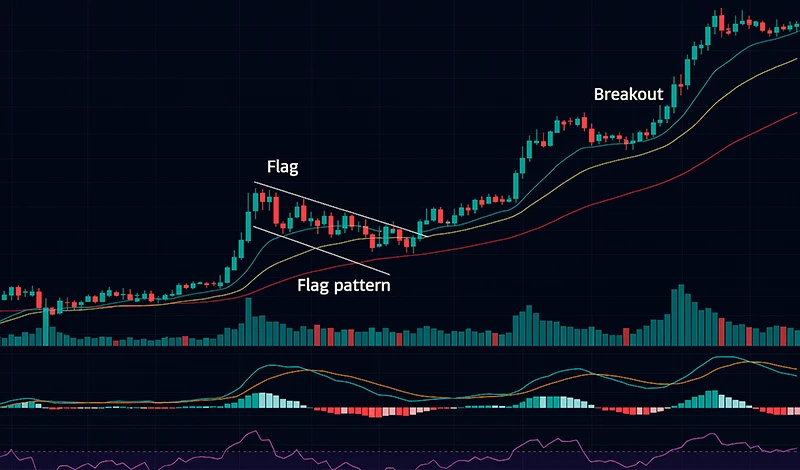
A flag pattern is a well-recognized continuation formation that develops after a sudden and steep price move, often called the flagpole. Once this surge is complete, the market typically enters a consolidation phase, creating the shape of a flag. This flag portion can slope slightly against the main trend or move sideways in a narrow channel. In bullish markets, the flag usually tilts downward or sideways as prices take a breather before pushing higher, while in bearish markets, the flag tends to slope upward or sideways before the downtrend resumes.
The significance of this structure lies in its ability to reveal a temporary pause in market activity rather than a complete reversal. Traders interpret the flag as a moment of balance between buyers and sellers, where the market regains energy before continuing in the same direction as the original move. Because of its clear geometry and the frequency with which it appears, the flag pattern is considered one of the most dependable tools in technical analysis for identifying high-probability trading opportunities.
🔗 Understanding
Understanding the Mechanics of Flag Patterns
The mechanics of a flag pattern are rooted in how price behaves during strong trending markets. After an explosive move in one direction, the market rarely moves in a straight line forever. Instead, it pauses, consolidates, and often resumes the original trend. This pause, when visualized on the chart, creates the well-known flag shape. Understanding each part of the pattern helps traders recognize and respond to it more effectively.
Anatomy of the Flag Pattern
- Flagpole: The flagpole is formed by a sharp and decisive move, either upward in bullish cases or downward in bearish ones. This phase is usually accompanied by a surge in volume, showing strong conviction by market participants. The steepness of the flagpole sets the tone for the strength of the entire pattern.
- Flag: After the surge, price action slows down and enters a consolidation phase, represented by a rectangular or slightly sloped channel. The flag often tilts against the preceding move—downward in bullish patterns and upward in bearish ones. This stage reflects a temporary balance where traders lock in profits, new participants join, and the market digests the previous momentum. Importantly, volume usually decreases here, signaling reduced activity while the market pauses.
- Breakout: The breakout marks the resumption of the initial trend. Price pushes out of the consolidation zone in the same direction as the flagpole, ideally with a strong uptick in volume. This surge in activity confirms that the period of rest is over and that the dominant trend has reasserted itself. Breakouts are often where traders look to enter positions, aiming to capture the continuation move that follows.
This sequence—from pole to flag to breakout—creates a reliable roadmap for understanding how trends temporarily pause before continuing. Recognizing these mechanics allows traders to anticipate the next stage of price action with greater confidence.
Volume Dynamics in the Pattern
Stage | Price Action | Volume Behavior |
Flagpole | Sharp trend move | Volume spikes |
Flag | Consolidation/congestion | Volume declines |
Breakout | Resumed trend direction | Volume increases again |
Volume normalization during consolidation signals indecision, while volume expansion on breakout confirms trader conviction.
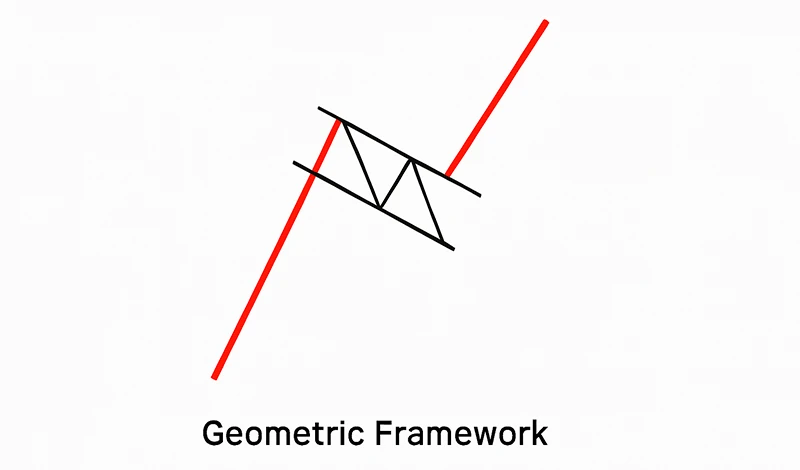
Geometric Framework
Flag formations are defined by two roughly parallel trendlines encompassing the consolidation. These trendlines may be flat or slanted slightly against the prior trend. This geometric clarity facilitates easier identification and precise entry points in trading.
🔗 Why
Why is Flag Pattern important in Technical Analysis?
Flag patterns hold a special place in technical analysis because they provide traders with a structured and repeatable way to approach the market. Their design is simple enough to recognize across different instruments and timeframes, yet powerful enough to guide trading decisions with a higher degree of confidence. By combining a strong initial move with a well-defined consolidation, they create a roadmap that helps traders anticipate the next likely price development.
Another reason for their importance is their ability to balance clarity with flexibility. The clean geometry of the flag makes it easier to determine entry points, stop levels, and profit targets, while the underlying principle of continuation allows the pattern to adapt across forex, stocks, commodities, and cryptocurrencies. Since they frequently appear in trending markets, traders often use them to time entries after a pause, joining a trend with reduced risk compared to entering during the initial surge. Still, caution is necessary because false breakouts can occur when volume is thin or when the broader market lacks direction, reminding traders that even reliable patterns require confirmation and prudent risk control.
🔗 How
How To Identify Flag Patterns
Identification relies on spotting three critical elements:
1. A pronounced flagpole—a strong trend move, visibly steep and preferably supported by increased volume.
2. A flag—a pause or retracement contained within parallel lines, ideally lasting between a few bars up to several weeks (depending on timeframe).
3. A breakout—the price should exit the flag in the direction of the flagpole, ideally with higher volume.
Step-by-Step Checklist
- Confirm a clear preceding trend.
- Draw channel around the consolidation area—should look like a small slanted rectangle.
- Monitor volume: should decrease inside the flag, then rebound on breakout.
- Risk management: stop-loss just outside the consolidation, target equals flagpole projection.
External resources (for deeper understanding):
- Investopedia’s exploration of continuation patterns, including flags, pennants, triangles, rectangles, and ideal breakout strategies
- ChartSchool (StockCharts) defines the flag as a short rectangle sloping against the trend, contained within parallel lines
- Wikipedia: breakup of flag and pennant patterns, similarities and differences with pennants
🔗 Different
Different Types Of Flags You Should Keep An Eye Out For
Flag formations are not uniform, and their variations provide traders with different opportunities depending on the prevailing market trend and chosen trading style. While the basic structure of a flag remains consistent—a strong directional move followed by a consolidation channel—the direction and angle of the flag can change the way traders interpret the setup. Recognizing the differences between bullish and bearish flags, as well as smaller variations in slope or width, can significantly refine a trading approach.
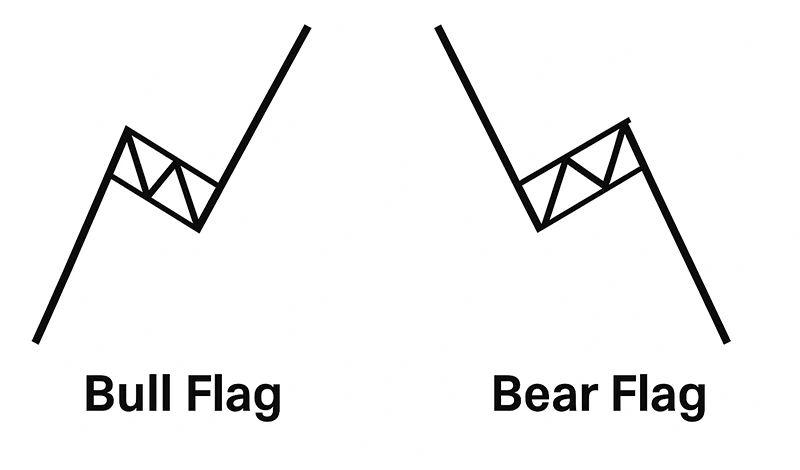
Bull Flag
A bull flag develops within an uptrend after a strong upward price surge forms the flagpole. The market then pauses, often drifting sideways or slanting gently downward in a narrow consolidation channel. This stage reflects temporary profit-taking by early buyers, while new participants evaluate entry opportunities. Once the breakout occurs above the consolidation zone, the trend typically resumes, and traders expect price to continue climbing. Bull flags are widely used because they align with the natural rhythm of strong uptrends and often provide favorable risk-to-reward setups for those looking to trade with momentum.
Bear Flag
The bear flag mirrors its bullish counterpart but appears during downtrends. After a sharp decline creates the flagpole, the market consolidates in a small channel that slopes upward or moves sideways. This slight upward drift represents a pause where sellers take a break and buyers test the waters. However, when the lower boundary of the flag breaks, selling pressure usually returns, leading to further declines. Bear flags are considered reliable tools for spotting continuation signals in bearish markets, helping traders capitalize on extended downward moves.
Variations
Not all flags look identical, and small differences can influence how traders manage them. Some flags remain horizontal, creating a clean sideways box, while others tilt slightly against the trend, forming downward or upward slants depending on the context. Consolidations may also vary in width, with some flags showing very tight ranges and others stretching wider across several candles. These differences impact entry timing, stop placement, and overall trade management. Additionally, flags are visible on nearly every timeframe, from one-minute charts for scalpers to daily and weekly charts for long-term traders. Recognizing these subtle distinctions allows traders to adapt strategies to their preferred style—whether they focus on rapid intraday trades or extended swing and position setups.
🔗 Used
How are Flag Patterns Used by Traders?
Flag patterns are used as decision points for entries, stop placement, and profit targeting. Traders typically:
- Enter a trade when price breaks above (bull flag) or below (bear flag) the consolidation channel, preferably on volume.
- Place stop-loss just beyond the opposite side of the flag (e.g., below flag in bullish setups).
- Set profit targets by projecting the length of flagpole from breakout point.
These patterns serve as guideposts within trend-following systems: enter with momentum, manage risk tightly, project reward via structural measurement.
In intraday or swing trading, bull flags can be spotted and traded frequently—on 1-, 5-, or 15-minute charts—allowing active traders to batch multiple setups per day.
Institutions may also follow flag patterns—especially tight consolidations—for breakouts with liquidity.
🔗 Best
What Time-Frame is Best to Trade a Flag Pattern?
Flag patterns appear on any timeframe—from one-minute scalping charts to daily and weekly logs. The “best” timeframe depends on trading style:
Trading Style | Common Timeframe | Notes |
Scalping/Intraday | 1-1 min, 5-15 min | Frequent signals; tight setups; require quick execution |
Day Trading | 15-1 hr | Moderate setups; intraday flag patterns offer clear targets |
Swing Trading | 4hr–Daily | Larger moves; more reliable setups; longer hold duration |
Position Trading | Daily–Weekly | Major trends; flag patterns offer context for trend entry |
Intraday flags suit fast-paced traders, but false breakouts are more common—requiring disciplined confirmation and tight risk control.
Swing and position traders benefit from clearer patterns and stronger volume confirmation, albeit with fewer opportunities.
NordFX guide on best time frames for intraday trading underscores the importance of aligning pattern signals with volatility and volume dynamics—suggesting a preference for early or active trading periods for intraday traders
🔗 Strategies
Strategies for Trading Flag Patterns
Trading flag patterns effectively requires more than just recognizing the shape on a chart. The key lies in timing the entry, controlling the stop-loss, and projecting realistic targets. Because these setups can appear in fast-moving markets, discipline and clear rules make the difference between success and unnecessary losses. Traders typically use one of several proven methods, each offering its own advantages depending on risk tolerance and trading style.
Breakout Entry
The most straightforward strategy is to enter when the price breaks out of the flag. A breakout above the upper boundary of a bullish flag or below the lower boundary of a bearish flag signals continuation of the prior trend. Waiting for a candle close outside the flag, instead of jumping in on the first tick, helps filter out false signals. This method suits traders who prefer decisive action and minimal delay between setup recognition and execution.
Pullback Entry
More conservative traders may wait for the breakout and then a brief pullback to retest the broken flag boundary before entering. This approach confirms that the breakout level is acting as new support or resistance. While this strategy offers a stronger risk-to-reward ratio and additional confirmation, it comes with the downside of occasionally missing powerful moves that don’t look back after breaking out.
Measured Move Targeting
Another popular method is to use the length of the flagpole as a guide for projecting price targets. After the breakout, traders add (in the case of a bullish flag) or subtract (for a bearish flag) the flagpole’s length to estimate where price is likely to reach. This measured move gives traders a logical and structured way of setting profit objectives rather than relying on guesswork.
Scaling Positions
Experienced traders sometimes scale into a flag breakout by entering with smaller initial positions and adding as the move gains strength. This allows them to reduce risk exposure in case of a failed breakout while also maximizing gains if the trend unfolds as expected. Scaling can be based on additional momentum signals, such as new highs in bullish moves or fresh lows in bearish ones.
Example Table: Bull vs Bear Flag Strategy
Pattern Type | Entry Trigger | Stop-Loss Placement | Target Projection |
Bull Flag | Break above flag top | Below flag low | Flagpole length added to breakout |
Bear Flag | Break below flag base | Above flag high | Flagpole length subtracted downward |
🔗 indicator
What type of indicator can be used with a Flag Pattern?
Flag patterns are powerful on their own, but many traders rely on technical indicators to confirm the validity of the setup and improve decision-making. Indicators provide additional layers of evidence that the breakout is genuine and not just a false signal caused by random market noise. By combining price action with indicators, traders can filter out weak setups, improve risk management, and strengthen confidence in their trades.
Volume Indicators
Volume plays a vital role in analyzing flag formations. A typical sequence involves high volume during the flagpole, reduced activity during consolidation, and renewed volume at the breakout. This behavior reflects the natural ebb and flow of market participation. Traders often use tools such as On-Balance Volume (OBV) or the Volume Oscillator to track these changes. When volume expands strongly during the breakout, it adds credibility to the continuation of the trend and helps confirm the pattern’s reliability.
Momentum Indicators
Momentum indicators are especially helpful in gauging whether the market still has enough strength to follow through after the breakout. The Relative Strength Index (RSI) identifies overbought or oversold conditions, which can signal if the market is resetting momentum during the flag. For instance, a bull flag forming while RSI cools off from overbought levels may provide the perfect setup for another leg upward. The Moving Average Convergence Divergence (MACD) is another widely used momentum tool, with bullish or bearish crossovers often coinciding with valid breakouts.
Moving Averages
Moving averages offer a straightforward way to confirm the prevailing trend. When short-term averages, such as the 20-period EMA, remain aligned with longer-term ones like the 50-period EMA, traders gain additional confirmation that the breakout is moving in harmony with the broader direction. Flags often develop above key moving averages in bullish markets or below them in bearish markets, and this alignment strengthens the probability of continuation once price breaks out of consolidation.
Volatility Indicators
Volatility indicators help traders anticipate how strong and sustained the breakout may be. Bollinger Bands, for example, often narrow during the consolidation phase of a flag, visually signaling reduced volatility. A breakout that pushes beyond the bands suggests a renewed surge in price activity. Meanwhile, the Average True Range (ATR) provides a numerical measure of volatility, which is especially useful for adjusting stop-loss distances to suit current market conditions. A wider ATR reading may call for a looser stop to avoid premature exits, while a narrower ATR can justify tighter risk management.
By integrating these indicators with the visual clarity of flag patterns, traders create a more robust framework that enhances both timing and accuracy in their trades.
🔗 risk
How to manage risk when trading the Flag Pattern?
Risk management is central, given that flag breakouts can fail in noisy markets.
Stop-Loss Placement
- For bull flags, stops go just under the consolidation low.
- For bear flags, stops go just above the consolidation high.
- Alternatively, ATR-based stops can adjust dynamically with volatility.
Position Sizing
- Use fixed percentage risk model (e.g., 1-2% of account equity per trade).
- Sizing positions relative to flag dimensions ensures risk remains controlled.
Diversification
- Avoid concentrating all trades on similar patterns across correlated assets.
- Spreading across instruments reduces exposure to simultaneous invalidations.
Confirmation Requirements
- Waiting for breakout confirmation—such as candle close outside the flag—minimizes premature entries.
- Combining with indicators, like MACD confirmation, adds robustness.
Trade Management
- Use trailing stops to lock in profits if the move extends.
- Partial profit-taking at interim levels can help balance reward and reduce pressure.
🔗 Advantages
Advantages and Disadvantages of Flag Patterns
Like any trading tool, flag patterns come with both benefits and drawbacks. Understanding these strengths and limitations helps traders decide when to rely on the formation and when to be more cautious.
Advantages
One of the biggest advantages of flag patterns is their straightforward visual recognition. The combination of a steep flagpole followed by a neat consolidation channel makes them easy to identify, even for less experienced traders. They are also known for their strong continuation potential, as the breakout often resumes the prior trend with significant momentum. Another strength lies in their versatility: flags are seen across multiple asset classes, from forex and stocks to commodities and cryptocurrencies, making them a universal trading tool.
Flag patterns also provide clear technical levels for planning trades. The edges of the flag act as natural boundaries for setting stop-losses, while the length of the flagpole offers a logical method for calculating price targets. This clarity reduces uncertainty and supports disciplined trading. Finally, flag setups combine well with other analytical tools, especially volume and momentum indicators, which can help confirm the validity of a breakout and enhance confidence in trade execution.
Disadvantages
Despite their appeal, flag patterns are not flawless. False breakouts are a common problem, particularly in low-volume environments or range-bound markets where price lacks conviction. This means traders must be patient and disciplined, waiting for confirmation rather than rushing into a position at the first sign of movement. Another limitation is that flags lose effectiveness in sideways or uncertain markets, where trends are weak and continuation patterns often fail to deliver.
Additionally, while measured moves based on the flagpole offer practical targets, there is no guarantee that price will always reach them. External factors such as economic news, unexpected volatility, or broader market conditions can interrupt the expected move. For these reasons, traders should treat flag patterns as one piece of the puzzle rather than relying on them in isolation, using proper risk management to protect against scenarios where the pattern does not perform as anticipated.
🔗 Risks
Recognizing The Risks Associated With Trading Flag Patterns
Even reliable setups have pitfalls. Awareness of risks prevents overconfidence.
False Breakouts
Markets may pierce flag boundaries briefly before reversing, trapping traders. Using confirmation and volume helps mitigate.
Market Conditions
Flag patterns are less reliable during low liquidity sessions or when broader markets are range-bound.
Overleveraging
Given the attractive risk-to-reward, traders might overuse leverage. This magnifies drawdowns when a flag fails.
Psychological Risks
Expecting every flag to succeed can lead to revenge trading. Traders must accept that losses are part of the strategy.
Example Table: Common Risks
Risk Type | Description | Mitigation |
False Breakout | Breaks boundary but reverses | Wait for candle close, volume rise |
Range Market | Noise distorts flag structure | Trade only in trending markets |
Leverage Misuse | Excessive size amplifies losses | Limit risk per trade to 1–2% |
🔗 After
What Happens After a Flag Pattern?
Typically, a breakout resumes the preceding trend. If the flag formed during an uptrend, continuation upward is expected; if in a downtrend, continuation downward is more likely.
Breakout Confirmation
- Volume increase often validates the breakout.
- Price should accelerate in the direction of the original pole.
Potential Outcomes
- Continuation Move: The ideal result, reaching projected target.
- Short-Lived Breakout: Market continues briefly, then stalls.
- Failed Pattern: Market reverses fully, invalidating flag.
Post-Breakout Behavior
- Traders often monitor for subsequent mini-consolidations, allowing pyramid entries.
- Breakout momentum can fuel larger trend phases, making flags stepping stones in extended moves.
An example: many forex traders track flags during volatile sessions such as London or New York overlaps, as liquidity fuels strong follow-through.
🔗 FAQs
FAQs
What distinguishes a flag from a pennant?
Both are continuation patterns. A flag is a rectangle channel, while a pennant converges into a small triangle.
How long does a flag typically last?
Depending on timeframe, from a few bars to a couple of weeks. Longer consolidations risk becoming different formations.
Can flags appear in cryptocurrency markets?
Yes, crypto assets often exhibit sharp moves and consolidations, making flags frequent and sometimes volatile.
Do all breakouts succeed?
No. False signals occur, so volume and confirmation remain crucial.
What is the minimum size of a flagpole for validity?
There’s no fixed size, but a noticeable steep move relative to preceding action is essential.
Should beginners trade flags?
Yes, with caution. Their clear structure makes them educational, but strict risk controls are required.
Which markets show flag patterns most reliably?
Highly liquid markets—major forex pairs, leading stocks, popular commodities like gold—tend to respect flag structures better.
திரும்பிச் செல்லவும் திரும்பிச் செல்லவும்
