
How to Short Bitcoin: A Step-by-Step Guide for Traders
How to short (sell) bitcoin?Short answer: Shorting Bitcoin means selling it at a higher price and buying it back later at a lower price to profit from the diffe ...
Read More
How to short (sell) bitcoin?Short answer: Shorting Bitcoin means selling it at a higher price and buying it back later at a lower price to profit from the diffe ...
Read More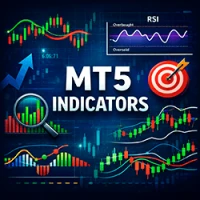
What are MT5 indicators?MT5 indicators are analytical tools inside MetaTrader 5 that process price and volume data to help traders identify trends, momentum, vo ...
Read More
Short answerA social trading broker is a broker that allows traders to follow, evaluate, and automatically copy the trades of other traders. In simple terms, on ...
Read More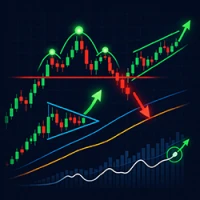
What are chart patterns and how do traders use them?Chart patterns are visual formations on price charts that help traders identify potential trend reversals or ...
Read More
CFD trading explained in simple terms: it is a way to speculate on price movements in financial markets without owning the underlying asset. When you trade CFDs ...
Read More
What Is a Dead Cat Bounce?Short answer: A dead cat bounce is a short-term price rebound that occurs after a sharp decline in a financial asset, followed by a co ...
Read More
What is the easiest way to start CFD trading as a beginner?Begin with demo trading to learn how the platform works, practice order placement, and understand ris ...
Read More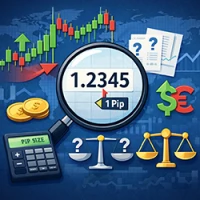
What does pip mean?Short answer: A pip is a standardized unit used to measure very small changes in price. It represents the minimal conventional price movement ...
Read More
Short answerThe simplest XAUUSD strategy for beginners is trading in the direction of the main trend using key price levels, without indicators. Beginners shoul ...
Read More
What is overtrading?Short answer: Overtrading is when a trader opens too many trades or trades too frequently without valid setups, usually driven by emotions r ...
Read More
